Rice Purity Score Chart: Fast Reference
The Rice Purity score chart below groups the 0-100 scale into five practical ranges. The chart works best as a first-pass guide. It can tell you whether a score is very high, high, middle, low, or very low, but it cannot tell you which answers created the number.
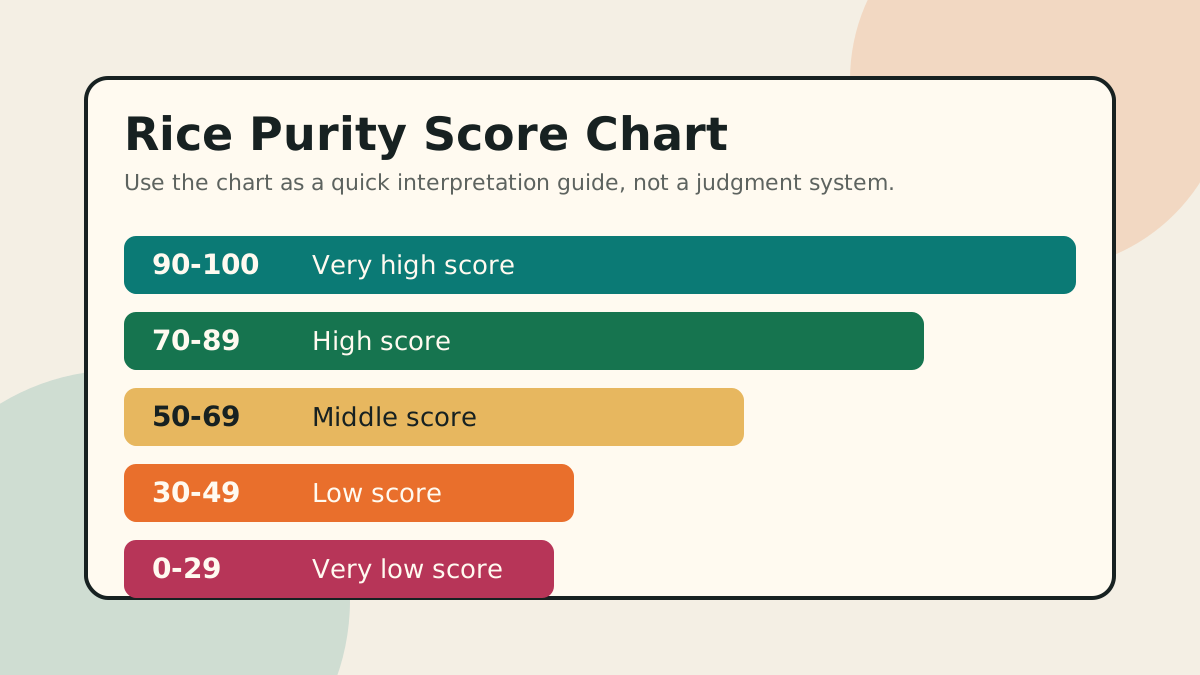
| 90-100 | Very high. Only a few items apply, or the user took a filtered version with fewer intense prompts. |
|---|---|
| 70-89 | High. Some social, school, or relationship items apply, but the score still sits near the top. |
| 50-69 | Middle. A broader set of experiences applies, and the exact meaning depends heavily on category mix. |
| 30-49 | Low. Many statements apply across several categories, so privacy and context matter more. |
| 0-29 | Very low. The user checked most of the list, but the score still should not be treated as a judgment. |
How to Read the Chart
First, match your score to the nearest range. Second, check which version of the test you took. A classic page, a teen-safe page, a couples page, and a college page may all produce a number from 0 to 100, but the range guide is most accurate when the question set is the same.
Third, avoid reading the chart as a ranking. A higher result is not automatically better, and a lower result is not automatically worse. The chart only shows how many prompts were checked. It does not show intent, safety, consent, maturity, culture, location, or the private context behind each answer.
Example Score Readings
Score 94 sits in the very high range. This usually means only a small number of statements applied.
Score 82 lands in the high range. It can reflect a mix of school, social, and light relationship experiences.
Score 61 is a middle result. The chart can name the range, but the categories explain more than the number.
Score 38 is a low result. This may be why people search for specific score meaning pages, because a broad chart can feel too general.
Chart vs. Score Meaning
The Rice Purity score chart is the fastest way to place a number into a range. A score meaning guide goes deeper by explaining privacy, version differences, and why two users can share the same score for different reasons. If you want the full explanation, read the Rice Purity Test score meaning page after checking this chart.
For searchers comparing with friends, the safest format is to share only the score range. Saying "I am in the 70-89 range" gives enough context for a light conversation without exposing checked answers. This range format supports that kind of low-pressure sharing.
When the Chart Helps Most
Use this chart when you want a quick reference after taking the quiz, when you want to explain a result without showing every question, or when you are building a printable or group version. Do not use it to pressure someone else, sort people by score, or make assumptions about a person's private life.
If you have not taken the quiz yet, start with the free anonymous test. If you are researching common results, continue to the average Rice Purity score guide. That page explains why averages are useful for context but weak as personal benchmarks.
Use the Chart With Your Result
Take the test first, then come back to this chart to read the range in context.
FAQ
What is a Rice Purity score chart?
A score chart is a 0-100 range guide that helps users interpret high, middle, and low scores after taking the quiz.
Is the score chart exact?
No. The chart is a broad interpretation tool. The exact meaning depends on the test version, question wording, and answer context.
What score range is most common?
There is no verified official average. Many online discussions center around middle and high ranges, but self-reported scores are not scientific data.